Back to all modules
Personalised dashboarding
All in one Dashboards to track activity and progress across all modules.
Take control of your processes
Finding out how things are going usually means asking around, opening spreadsheets and waiting for the weekly update. Aptus Dashboarding brings all of it to one screen. One look tells you how every process is going, per country and per team, live! Build the dashboard you and your team need, and skip the meeting that was only there to find out. Read below how it works, in three parts.
Tell us what you and your team need to see
One of our experts will show you how our Dashboard can bring it all together.
Book a discovery call
How it comes together
Three parts
Part 1
Build the Dashboard
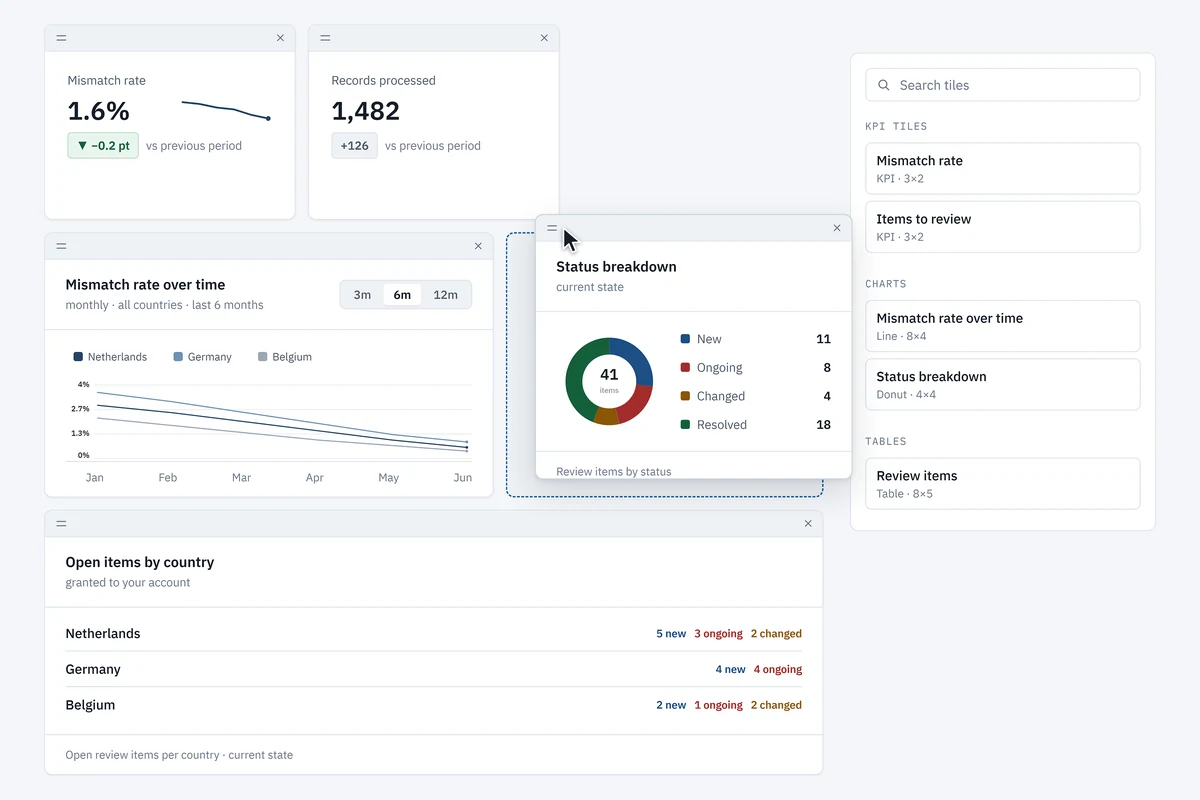
Building feature to easily create the Dashboard for your needs.
Composed from a library of tiles related to every Aptus module
Multiple Dashboards: a manager and a team member have different needs and rights, so also a different dashboard.
Easy drag and drop building. Drag tiles into the places you want to see them and adjust their details based on your preferences.
Part 2
Keep track of every process
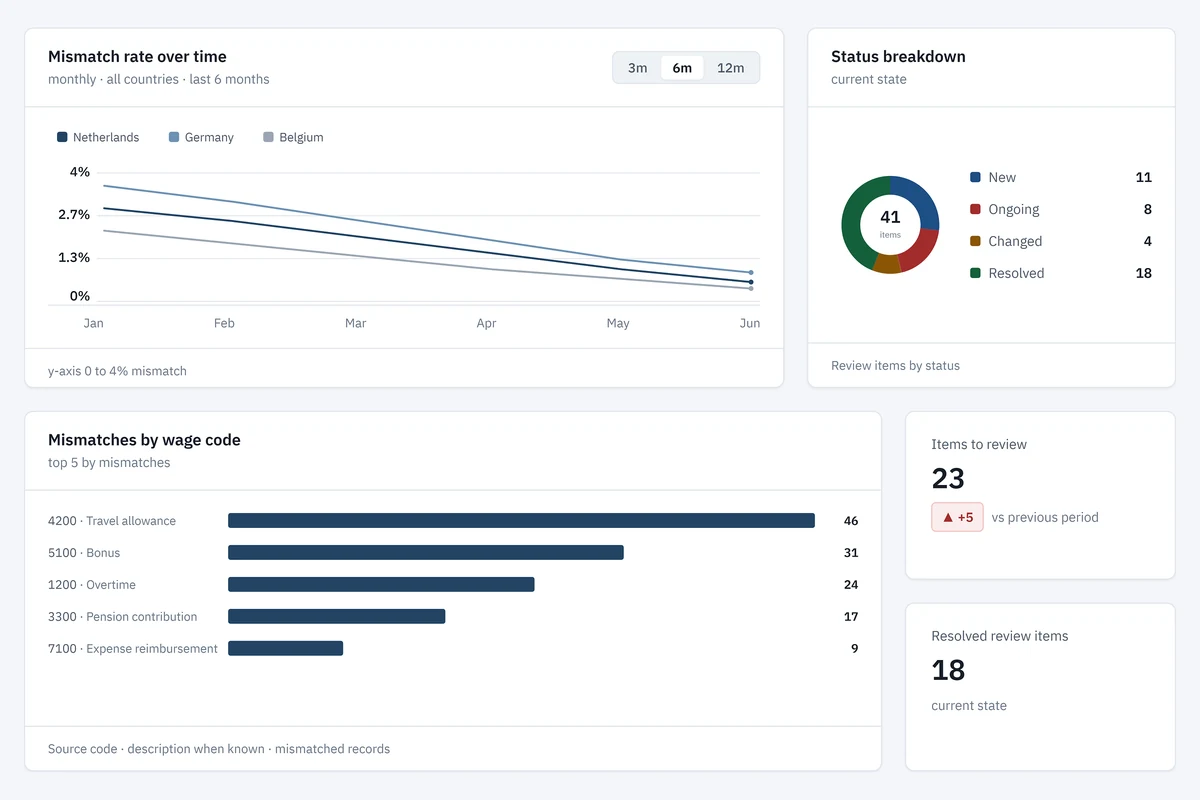
One look-up to see activity, status and progress across your processes.
Snapshots of now: status per country, differences per code, checks passed and failed. As a bar, a donut or a number.
Trends over time: differences per period, resolution speed and workload, as a line or a stacked bar.
Every graph filters on your countries, periods and modules, and updates live.
Part 3
Follow what is open
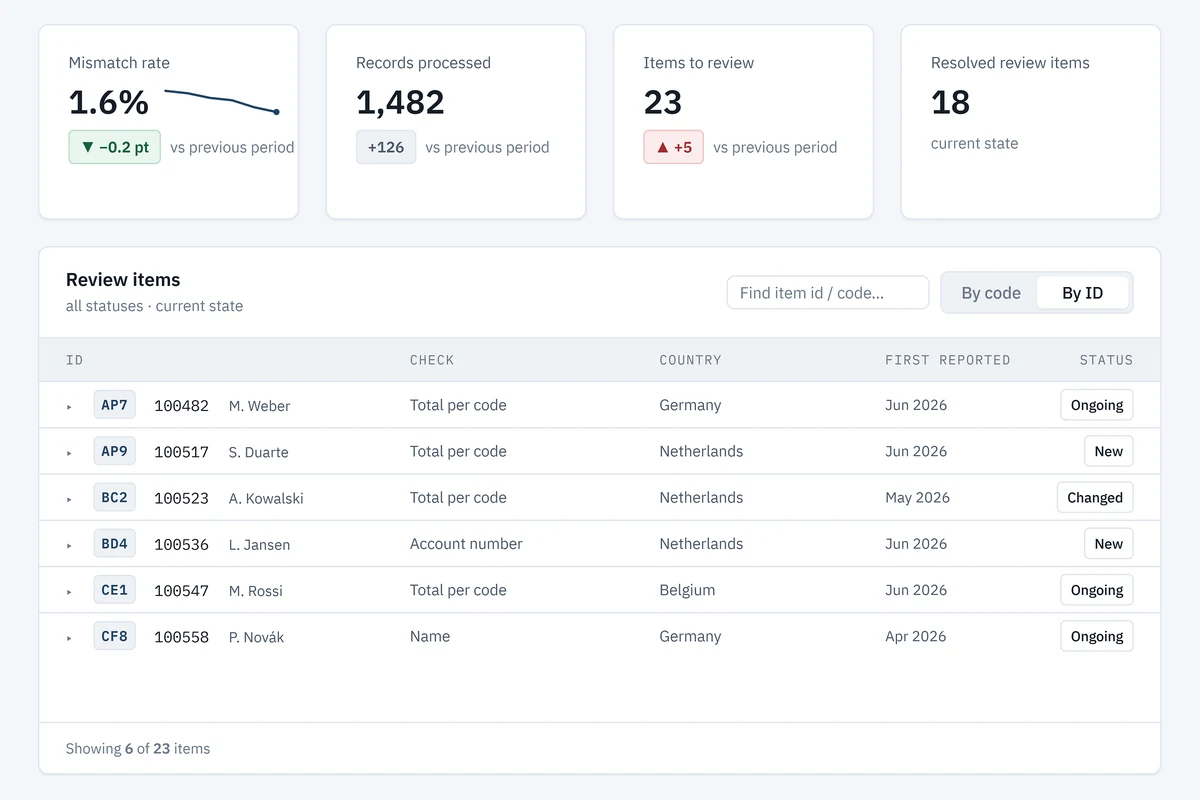
Every discrepancy and to-do, from the moment it is found to the moment it is closed.
Trackable statuses for discrepancies and to-do’s.
Automatic detection over time to check updates, giving you control over resolution speed.
Overview of the workload and its allocation within your team and their processes.
Discover how we can equip your team
A 30-minute discovery call with our global HCM experts.
Book a discovery call